  • Home
  • Weather
  • Climate
  • Ocean & Coasts
  • Fisheries
  • Satellites
  • Research
  • Marine & Aviation
  • Charting
  • Sanctuaries
  • Education
  • News and features
  • Tools & resources
  • About our agency
U.S. flag

An official website of the United States government

Here’s how you know

Dot gov

Official websites use .gov
A .gov website belongs to an official government organization in the United States.

HTTPS

Secure .gov websites use HTTPS
A lock (LockA locked padlock) or https:// means you’ve safely connected to the .gov website. Share sensitive information only on official, secure websites.

Find your local weather
Change location:
  • News
  • Tools
  • About
 
 
NOAA mobile logo
NOAA logo National Oceanic and Atmospheric Administration U.S. Department of Commerce


Breadcrumb

  1. Home
  2. Climate
  • Climate home
  • Climate 101
  • Collaborations and partnerships
  • Funding opportunities
  • Tools and resources
  • News and stories

Climate news and stories

Share:
Share to Twitter Share to Facebook Share by email Print
Climate.gov news and features
Drought.gov news
Heat.gov news and events
Unusual warmth pushed March 2020 into top-10 hottest for U.S.
April 8, 2020
Nation has also seen two billion-dollar weather and climate disasters this year, so far
A March 3, 2020, photo from the NOAA National Weather Service post-storm survey in East Nashville, Tenn., showing heavy damage to a neighborhood after tornadoes ripped through the region March 2-3.
Arctic sea ice reached its annual high on March 5
March 25, 2020
Arctic Ocean sea ice hit its annual peak for this year on March 5, 2020: This color-coded map shows Arctic sea ice concentration on March 5, 2020. Darkest blue indicates open water or ice concentration less than 15 percent. Shades of lighter blue to white indicate 15–100 percent ice cover. The gold line shows the median ice extent for this date over 1981–2010, an area of 6.04 million square miles (15.64 million square kilometers). Median falls “in the middle” because half of the years in the
U.S. Spring Outlook forecasts another year of widespread river flooding
March 19, 2020
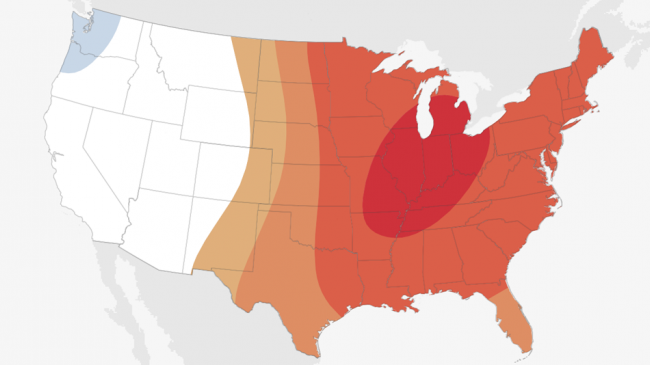
Above-average temperatures expected from coast to coast
Springtime along the foggy shoreline of the Kalamazoo River with a redbud tree in bloom. Michigan, USA. March 2020.
February 2020 ends as 2nd warmest on record for globe
March 17, 2020
This global map shows where February 2020 temperatures were up to 11° F (6° C) cooler (darkest blue) or warmer (darkest red) than the 1981-2010 average.
Earth just had its 2nd-hottest February on record
March 13, 2020
A collage of typical climate and weather-related events: heatwaves, drought, hurricanes, wildfires and changes in sea ice coverage.
Historically what have been the coldest and warmest 1st days of spring?
March 11, 2020
Spring flowers in snow.
NOAA to announce U.S. Spring Outlook and flood risk on March 19
March 11, 2020
An aerial view of Offutt Air Force Base and the surrounding areas affected by flood waters March 17, 2019. An increase in water levels of surrounding rivers and waterways caused by record-setting snowfall over the winter in addition to a large drop in air pressure caused widespread flooding across the state of Nebraska. See more Air Force photos at https://www.afspc.af.mil.
Winter was the 6th hottest on record for U.S.
March 6, 2020
February was wetter and warmer than average
February 11, 2020 -- An aerial photo of a levee failure that flooded the Springridge Place Subdivision in Yazoo County, Mississippi, following heavy rainfall. Four homes and a church were threatened.
Hot, cold or draw: Which climate conditions are mostly likely this March?
March 3, 2020
Across the eastern half of the U.S., March 2020 temperatures are more likely to be in the upper third of the 1981-2010 climate record (red colors) than in the middle or lower third. Darker colors mean higher chances, not more extreme temperatures.
NOAA monthly U.S. and global climate call is February 20
February 18, 2020
Experts recap January and provide outlooks through May
A collage of typical climate and weather-related events: heatwaves, drought, hurricanes, wildfires and changes in sea ice coverage.
  • Go to first pageFirst
  • Go to previous pagePrevious
  • …
  • Page 35
  • Page 36
  • Page 37
  • Page 38
  • Currently on page 39
  • Page 40
  • Page 41
  • Page 42
  • Page 43
  • …
  • Go to next pageNext
  • Go to last pageLast
View all
Last updated December 4, 2024
Have a comment on this page? Let us know.
NOAA Home
Science. Service. Stewardship.
  • News
  • Tools
  • About
  • Resources for Tribal & Indigenous Communities
  • Bipartisan Infrastructure Law (BIL)
  • Inflation Reduction Act (IRA)
  • Protecting Your Privacy
  • FOIA
  • Information Quality
  • Accessibility
  • Guidance
  • Budget & Performance
  • Disclaimer
  • EEO
  • No-Fear Act
  • USA.gov
  • Ready.gov
  • Employee Check-In
  • Staff Directory
  • Contact Us
  • Need Help?
  • COVID-19 hub for NOAA personnel offsite link
  • Vote.gov
Stay connected to NOAA
NOAA on Twitter NOAA on Facebook NOAA on Instagram NOAA on YouTube
Back to top